Open to Data Analyst / BI roles

I turn messy data into numbers a business can trust.

Computer Science graduate (2026) building analytics that start with a business question: clean and validated data, a clear model, then dashboards people actually use. Based in New Cairo, open to roles in Egypt or remote.

SQLPower BI · DAXPythonDatabricks · PySparkn8nExcel
Portrait of Abdallah Tarek
New Cairo, Egypt
5data sources unified into one Customer 360 model
300K+order records cleaned and validated
884K+records covered by automated quality checks in n8n
Projects

Each project starts with a business question.

What the business needed, what I built, and what I found.

Customer360 Analytics & Automation Platform

Databricks · PySpark · SQL · Power BI · n8n

The business problem

Customers, orders, products, support tickets and clickstream lived in five separate sources, each with its own quality problems. Nobody could trust a single number.

What I built

  • One Customer 360 model in Databricks (Bronze, Silver, Gold): 3 fact tables and 4 dimensions.
  • Cleaning and validation rules on 300K+ order records.
  • Automated data quality checks on 7 Gold tables (884K+ records) in n8n, with issue classification and audit logging in Google Sheets.
  • Power BI dashboards for customer, order and support KPIs.
  • Configured an Incremental Refresh policy in Power BI, and used Performance Analyzer to inspect DAX query and visual rendering performance.

What I found

1,734 duplicate customer IDs, 1,040 missing emails and 11,163 orders flagged for customer-related data issues. I turned the results into 4 recommendations with a 90-day action plan.
View code and documentation on GitHub ↗
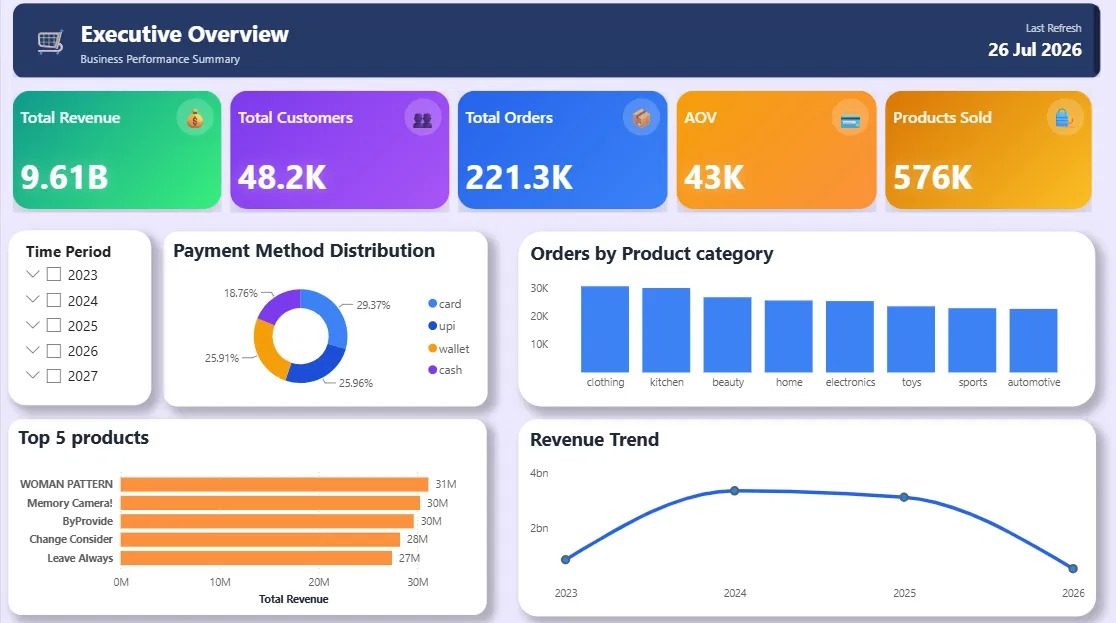
Customer360 Executive Overview dashboard in Power BI

Select a tab to view each dashboard, the data model, or the n8n workflow. Click the image to enlarge.
Uber Business Intelligence Report

SQL · Business analysis · KPI reporting

The business problem

Where does a ride-hailing business lose revenue, and which riders and zones matter most?

What I did

Analyzed 20,000 trip records across 4 cities with SQL: revenue, cancellations, surge pricing, rider behavior and driver performance.

What I found

4 business recommendations covering rider retention, surge-zone coverage, wait times and driver allocation. The $106K leakage and $40K–$60K opportunity are estimates based on project assumptions.

View code and documentation on GitHub ↗
14.8%cancellation rate
22%of riders generate 75% of revenue
~$106Kestimated revenue leakage

Football Scouting System

Graduation project (A+) · Python · Excel · Power BI · Machine learning

The business problem

Clubs compare players by reputation. I wanted a consistent, data-based way to scout players across attack, defence and goalkeeping.

What I built

  • Aggregated and standardized 4,000+ player records to support a machine learning-based scouting pipeline.
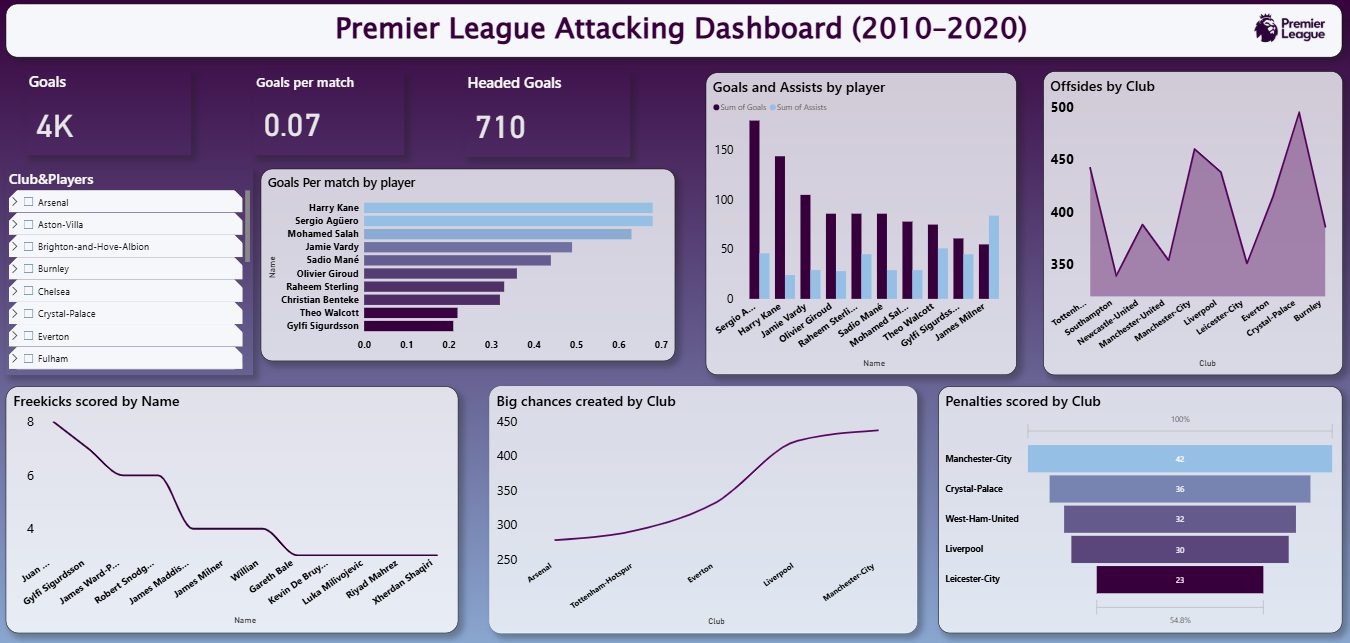
  • 20+ performance KPIs and interactive Power BI dashboards for player analysis and comparison: attacking, defensive, goalkeeper and player profile.
  • Extended the analysis to 195+ countries across 10 global indicators for interactive geographic exploration.
Premier League attacking dashboard in Power BI

Click the image to enlarge.

More dashboards

Sales Performance Dashboards

Power BI · DAX · Power Query

The business question

What drives sales and profit for a wholesale company, and which customers, salespeople and products matter most?

What I built

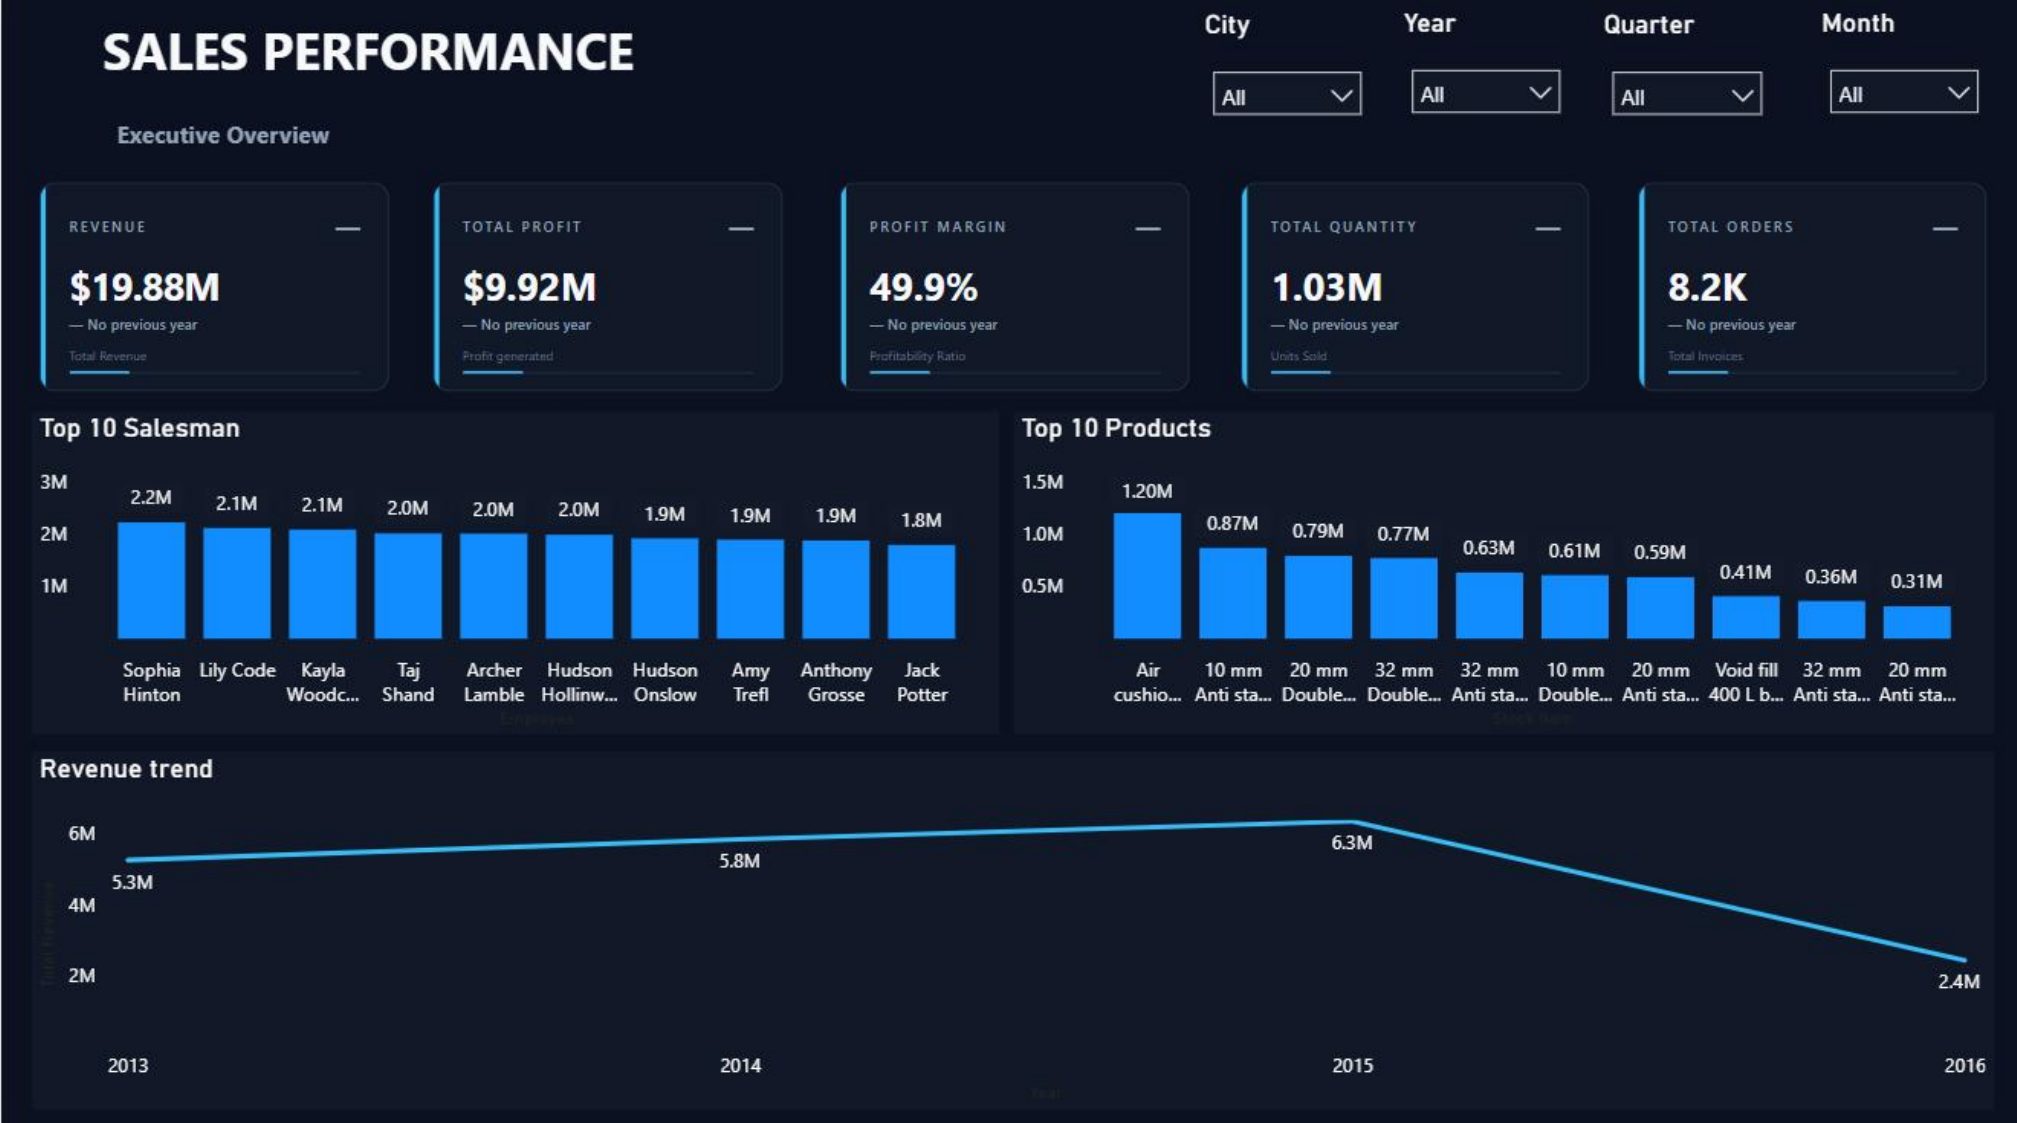
A 3-page report: Executive Overview, Customer & Salesperson, and Sales & Profit. It covers $19.88M revenue, $9.92M profit and 8.2K orders, with City, Year, Quarter and Month filters.

View code and documentation on GitHub ↗
Sales Performance executive overview dashboard

Global Geographic Analysis

Power BI · Power Query · CSV · GitHub

What I built

Three interactive dashboards covering population, education, literacy, employment and economic indicators across 195+ countries, with data cleaning, validation and geographic comparisons.

Telecom Customer Churn Analysis

SQL · Power BI · Data cleaning

The business problem

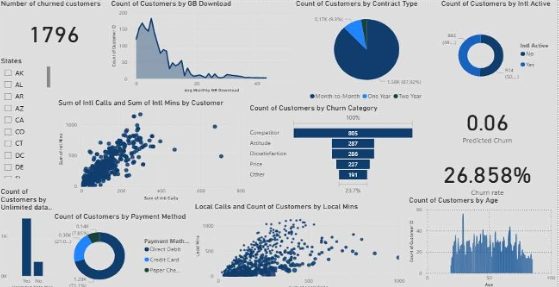
A telecom lost 1,796 of 6,687 customers (27%). Who leaves, and what could keep them?

What I did

Cleaned the data (including inconsistent churn labels), then compared churn across contract type, payment method, geography and usage. I flagged gaps in the churn-reason data.

What I found

Month-to-Month contracts and Direct Debit payers churned more. Recommendations: targeted outreach, flexible plans and personalized offers for high-risk segments.

View code and documentation on GitHub ↗
Telecom churn dashboard in Power BI showing churned customers, contract type and churn categories

Telecom Customer Churn Analysis Dashboard · Power BI

Experience

Hands-on training and teaching.

Data Analyst Trainee

DEPI
Jul 2025 – Dec 2025
  • Applied SQL, Python, Power BI and Tableau in hands-on analytics projects covering data cleaning, validation, transformation and visualization.
  • Analyzed healthcare datasets (clinics, doctors, patients and revenue) to identify performance patterns and potential revenue improvement opportunities.
  • Built interactive Power BI reports with Power Query, DAX and data modeling to monitor KPIs and communicate findings.

Coding Instructor (part-time)

iSchool
Jul 2026 – Sep 2026
  • Delivered 30+ programming and technology sessions to 60+ students across 6 cohorts.
  • Explained technical concepts through hands-on exercises and project-based learning.
  • Guided student teams through programming projects, supporting problem-solving and practical application.
Skills & education

Tools I use, and where I learned them.

Technical skills

SQL & analysis

SQLData cleaningData validationEDAKPI analysis

BI & visualization

Power BIDAXPower QueryData modelingTableau

Excel

PivotTablesXLOOKUP / VLOOKUPReporting

Python

PandasNumPyMatplotlibScikit-learn

Data engineering & automation

DatabricksPySparkDelta LakeETL pipelinesn8n

Tools

GitGitHubJupyterVS Code

Education

  • BSc in Computer ScienceModern Academy, Cairo · 2022 – 2026
  • Grade: Very goodGraduation project: A+

Military service

  • Exempted

Courses & certifications

  • SQL Analyst TrackDataCamp
  • Power BI Analyst TrackDataCamp
  • Digitera Program, Business TrackiCareer with Plan International Egypt · Sep 2026

Training

  • Machine Learning TrainingIT Shark
  • AI for Data AnalysisOrange Digital Center / Digital Hub
  • Data Analysis TrainingDigitera / EraaSoft
  • Tech for Non-TechiesiCareer

Let's talk about your data.

I'm looking for an entry-level Data Analyst or BI role. The quickest way to reach me is email or LinkedIn.

abdallahtarek.work@gmail.com+20 120 898 6995New Cairo, Egypt